
· By www.kapples.ch
Fruit Snack Sugar Content Comparison Chart (2026): Which Snacks Keep Added Sugar Low?
If you grab a “fruit snack” in 2026, the number to watch is not how colorful it looks, it is how much added sugar you are actually getting. Many people assume “fruit flavored” means fruit, but the Fruit Snack Sugar Content Comparison Chart question is simple, do you get a real sugar impact or a sugar trap.
Key Takeaways
| What to compare | Why it matters | What to look for in 2026 |
|---|---|---|
| Total sugars vs added sugars | “Fruit sugars” are not the same as added sugar | Prefer no added sugar, sugar swap ingredients, clean label |
| Fiber integrity | Fiber helps support satiety and helps blunt spikes | Choose products that keep fruit structure, not strip it |
| Carbohydrate format | Bars, gummies, and “cloud” formats behave differently | Compare sugar impact by format, then choose |
| Clean Label ingredients | No chemicals in the 100% natural product | Local ingredients, honest commitment |
| “Sugar free” claims | Sometimes “sugar free” still means sweet taste strategies | Read added sugar, not only headline claims |
- In 2026, the Fruit Snack Sugar Content Comparison Chart starts with added sugars, not total sugars alone.
- Prefer no gluten no sugar added natural product because it keeps snacking cleaner for families.
- We build around a two-ingredient core, Swiss apples and egg whites (albumin), so the “healthy snack bars” question becomes predictable.
- Use the fruit snack nutritional comparison mindset, sugar plus fiber plus format, not only sugar.
- If you want the full method behind this style of comparison, our 2026 Fruit Snack Nutrition Database, sugar, fiber, and GI scores explains the clean-label checklist we use in 2026.
- For school routines, see our healthy school snacks for kids guide, because the best comparison is the one you can actually repeat at home.
Why a Fruit Snack Sugar Content Comparison Chart is not optional in 2026
In 2026, “healthy snack bars” are everywhere, but the label language often hides the same problem. You get the fruit story, while the added sugar strategy does the heavy lifting.
That is why our Fruit Snack Sugar Content Comparison Chart focuses on the real decision layer, added sugars per serving. Total sugars can include naturally occurring sugars, added sugars cannot.
When families ask us for a no gluten no sugar added natural product, they are not asking for a marketing phrase. They are asking for a cleaner sugar experience, especially for snack for kids and snack for mothers who manage real schedules.
And we keep the standard practical. We try to use local ingredients, we use no chemicals in our 100% natural product, and what grows in the orchard is what ends up in your snack. Full stop.
Added sugar vs “fruit sugars”: what the chart should actually compare
If you have ever reached for a “fruit snack” because you thought it was whole fruit, you already know the frustration. The taste can be “fruit-like”, the nutrition can be “sugar-forward”.
So here is what our method insists on in 2026 for a Fruit Snack Sugar Content Comparison Chart.
- Added sugars per serving, because that is what pushes glycemic load and sweet taste over the edge.
- Fiber integrity, because stripping fiber and replacing structure is how you lose satiety.
- Carbohydrate format, because gummies, bars, and dried-like pieces do not behave the same.
This is the “Sugar Trap vs Whole Fruit Nutrition” logic behind our comparisons in 2026. Our goal is not just to reduce sweetness, it is to keep the fruit’s cellular matrix and pectin behavior as close to whole fruit as we can.
If you want the broader context for how we connect sugar with fiber and satiety, start with Fruit Snack Nutrition Comparison.
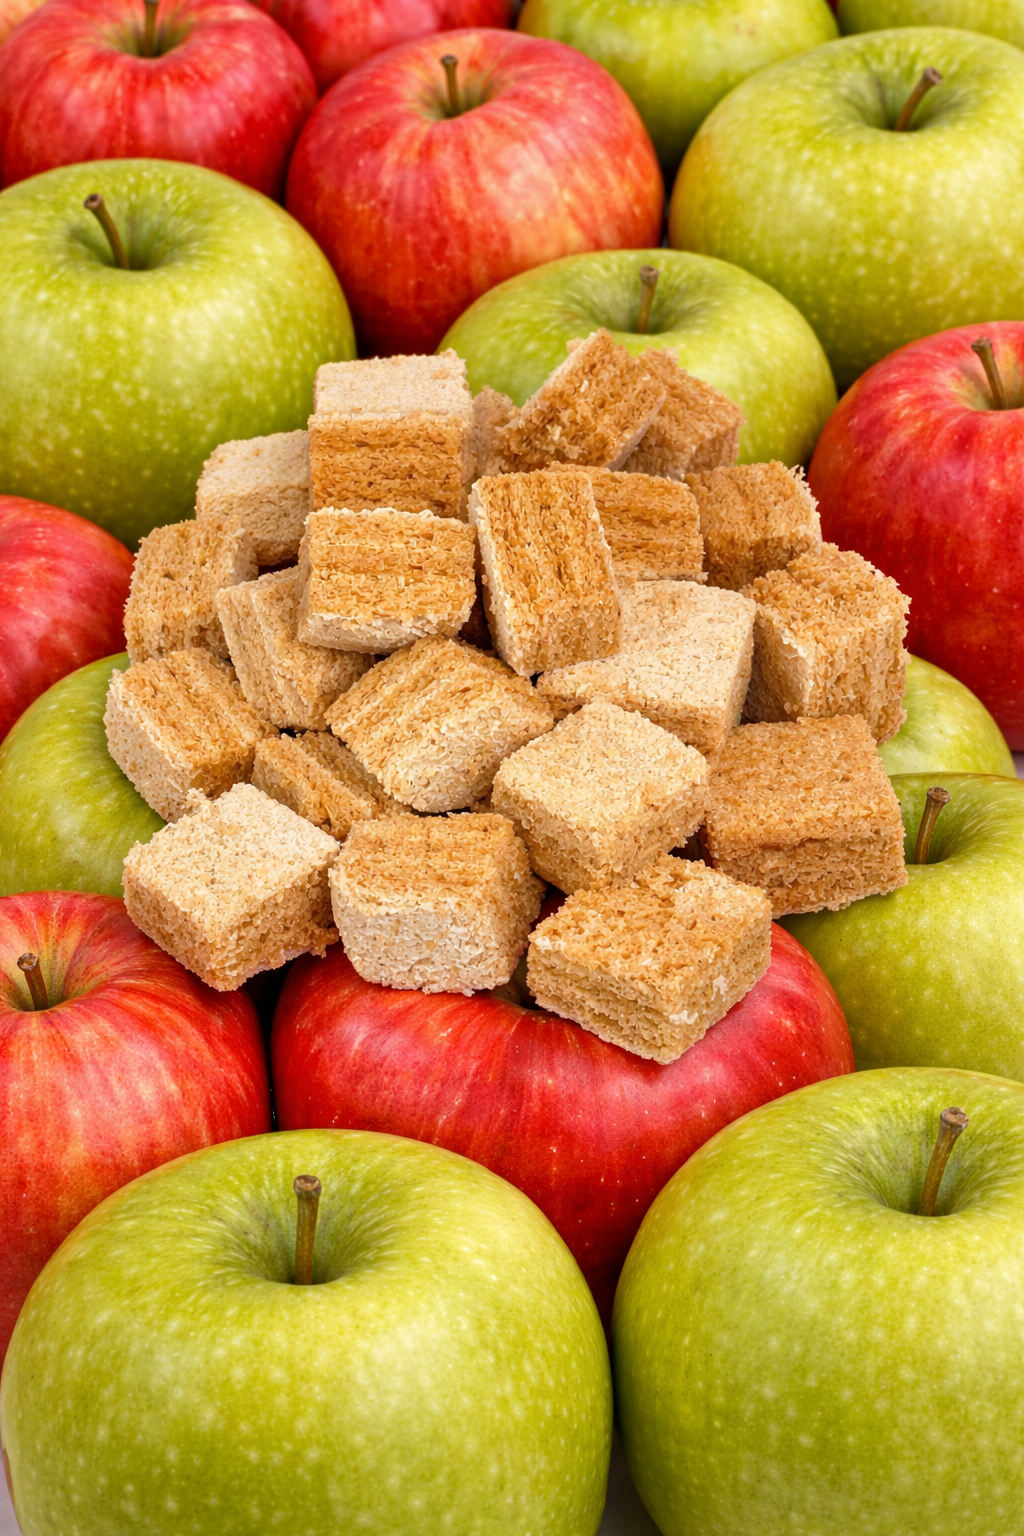
Two ingredient core, clean label choices, and the sugar impact you can feel
Strip the fiber, add sugar, use concentrate, import from unknown orchards. That is the shortcut recipe. We do not use it.
This is exactly the philosophy behind every single product we make at Kapples: a natural product that respects the fruit, keeps the fiber, and adds nothing unnecessary. It is also exactly why our no gluten no sugar added natural product is built for consistent everyday snacking in 2026.
Our core is simple, Swiss apples and egg whites (albumin). That combo supports structure without forcing a sugary profile to do the job.
When you build around that, the Fruit Snack Sugar Content Comparison Chart becomes less about guessing and more about choosing a predictable clean label route.
Best fruit snack sugar comparison by format: bar, pieces, and cloud
In 2026, the chart readers usually want is the one that matches how they actually snack. So we compare by format, because “sugar content” is not the whole story.
Here is the practical way to think about a Fruit Snack Sugar Content Comparison Chart, bar format, bite size pieces, and cloud-like textures.
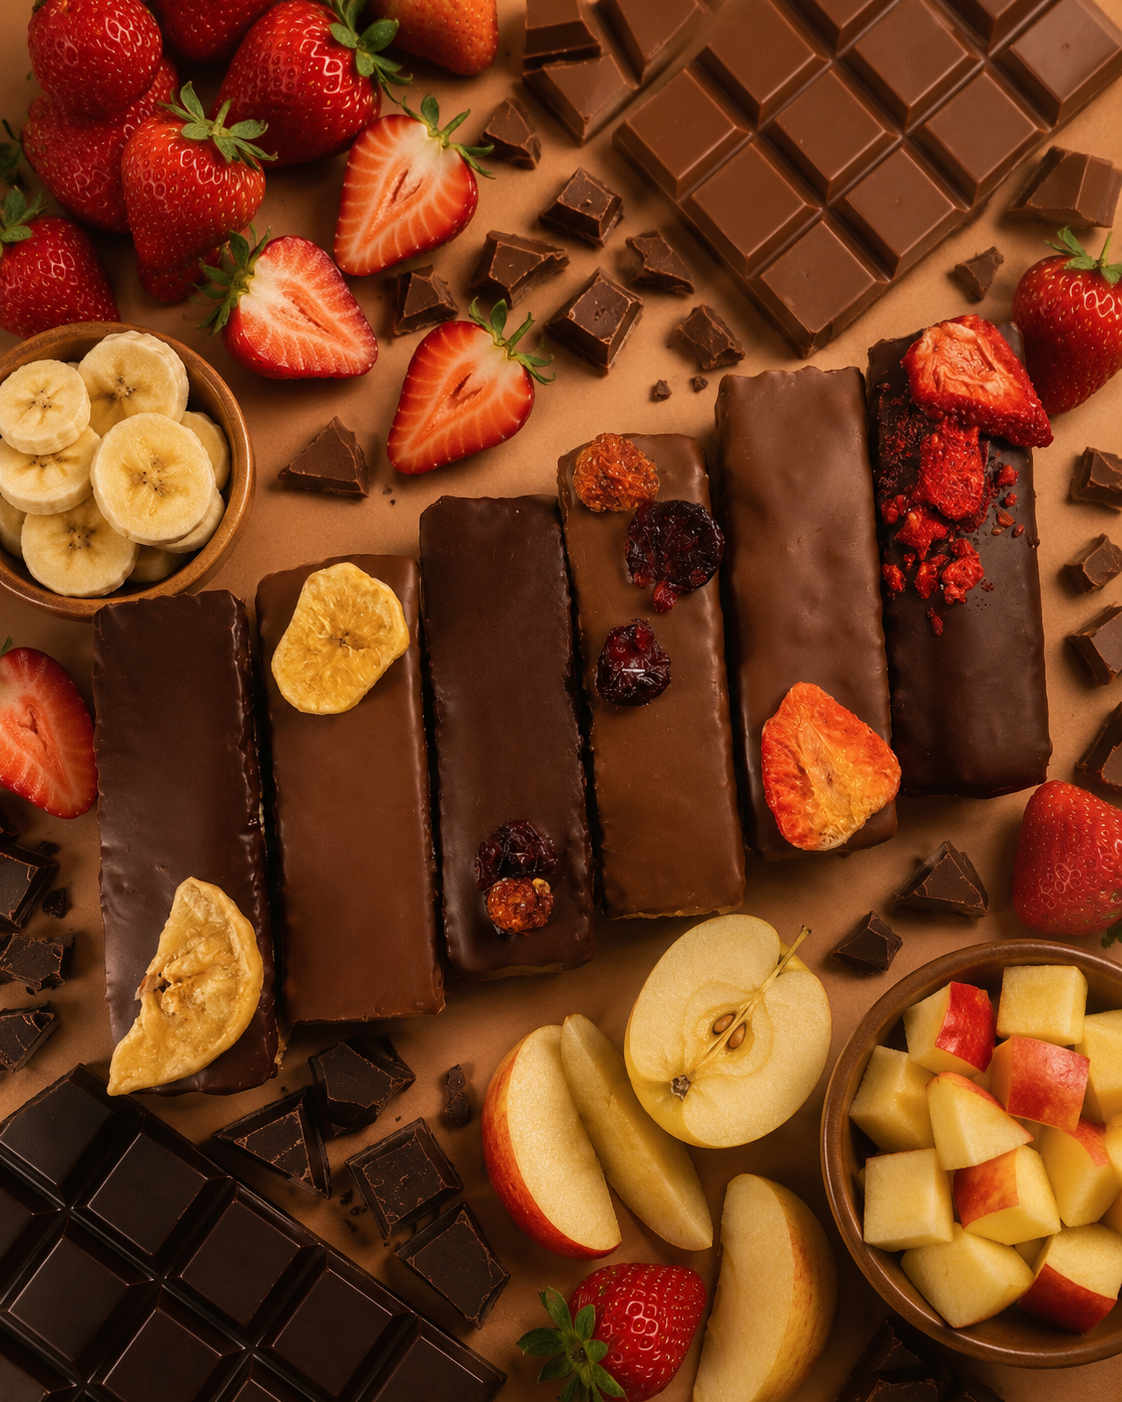
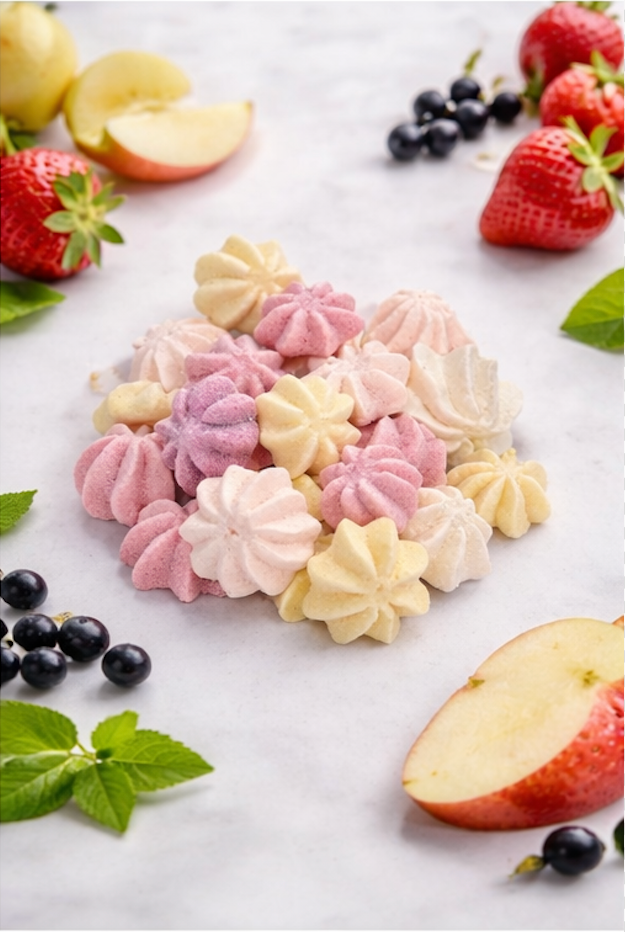
- Bars often feel more “stable” in the mouth, but the sugar content check still matters. Compare added sugars first, then look at fiber integrity.
- Pieces can trick you into eating faster. In 2026 we prefer per serving checks that match portion reality.
- Cloud-like snacks can look lighter. The comparison chart still needs to ask, how much added sugar is hiding behind the texture.
If you want the GI and GL layer to go with this sugar chart logic, use our Fruit Snack Glycemic Index Comparison Chart alongside the sugar comparison.
Local Swiss sourcing and why “no chemicals” belongs in the sugar conversation
When we say we try to use local ingredients, we mean the story behind your sugar impact. Our Swissness Standard is production method, not just packaging claims.
That commitment starts at the farm level, not in the packaging room. We source apples locally in the Vaud region, and we use egg whites from Aargau to keep a short farm-to-production journey.
In 2026, people are tired of abstract “natural” statements. They want clean label proof. So we stick to our no chemicals in our 100% natural product rule, and we keep the cellular matrix and pectin structure, not destroy it.
This matters for the Fruit Snack Sugar Content Comparison Chart because sugar is only one part of the blood sugar experience. Fiber and structure help influence how the sugar load behaves after you snack.
How we build K’Apples for low sugar snacking, for kids, mothers, and sports
K’Apples are highly recommended to try for ladies and gentlemen from 3 to 103 years old. That is not a tagline for us, it is a practical promise that the snack fits real bodies and real snack moments.
In 2026, that means our Fruit Snack Sugar Content Comparison Chart must make sense for three common use cases.
- Snack for kids, where you want a no gluten no sugar added natural product that does not turn snack time into a sugar spike.
- Snack for mothers, where you need a clean label option you can trust without reading ten lines of ingredients every time.
- Snack for sports, where you want fruit-based snacking that supports steady energy, not an abrupt sweet crash.
That is why we treat production method as a moral choice about fiber integrity, not just a manufacturing preference. The apple's natural structure is respected, not destroyed.
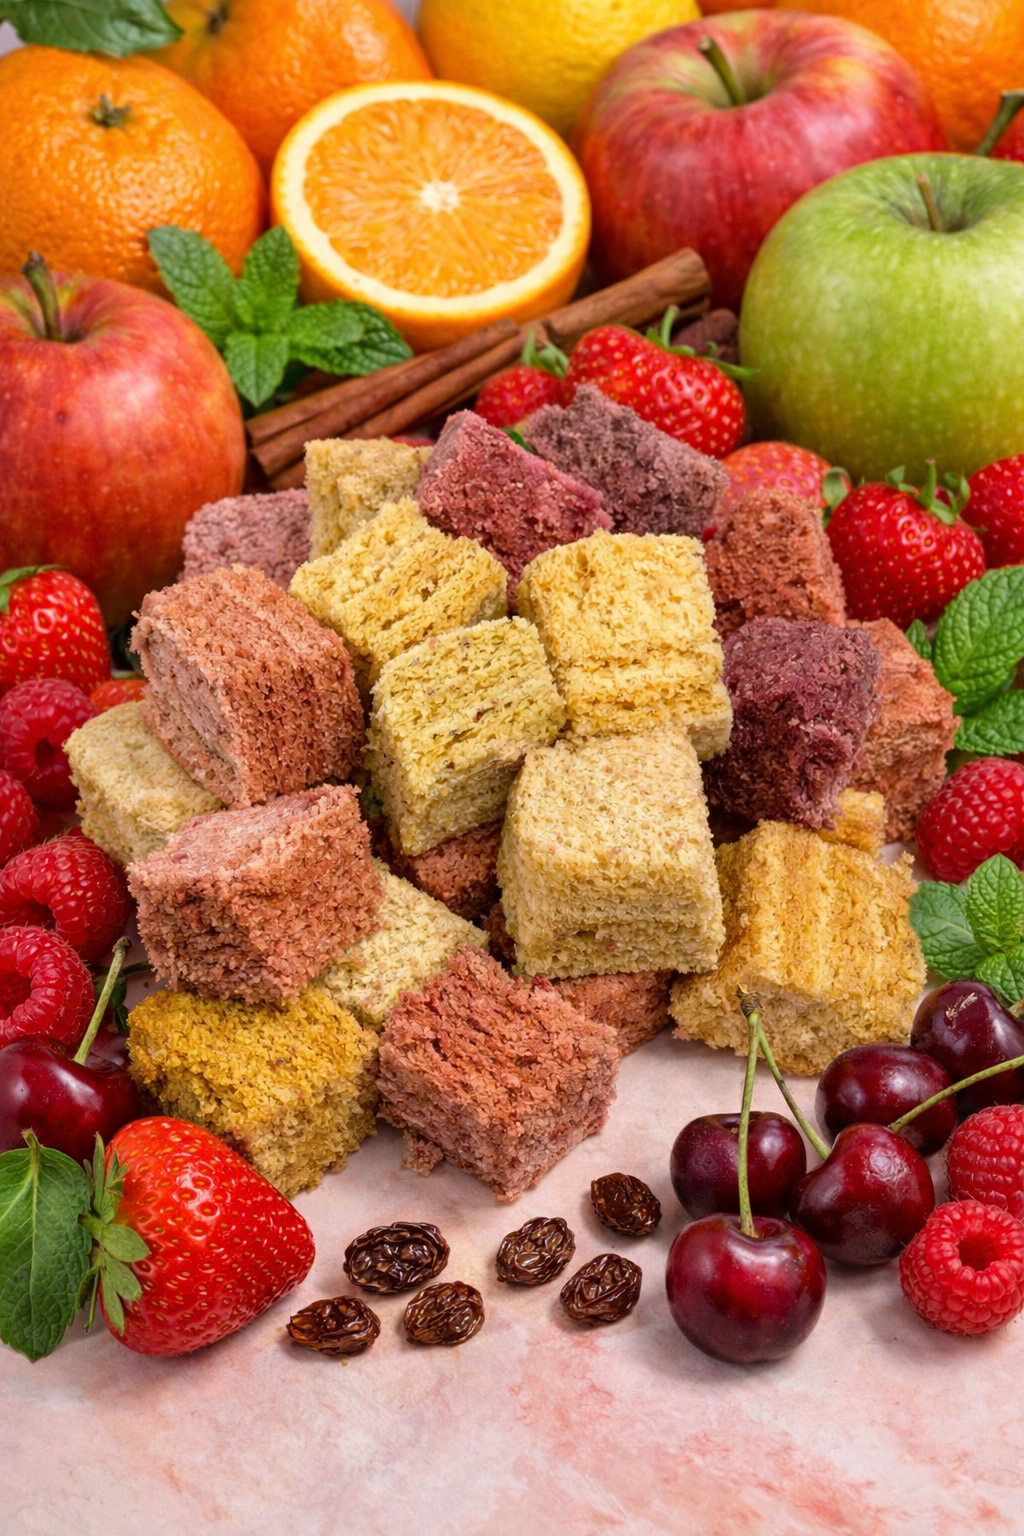
We also keep the craft details that show we are not cutting corners. If you ever wonder why our cubes look consistent, it is the K'Apples cake trimming story, we cut and trim 2 to 3 cm off each side to create perfect cubes. No shortcuts.
Want to browse options by line instead of guessing flavors? Use our assortment pages for an instant compare experience in 2026, for example: K'Apples Maxi Kit or Mystère K’Apples variety.
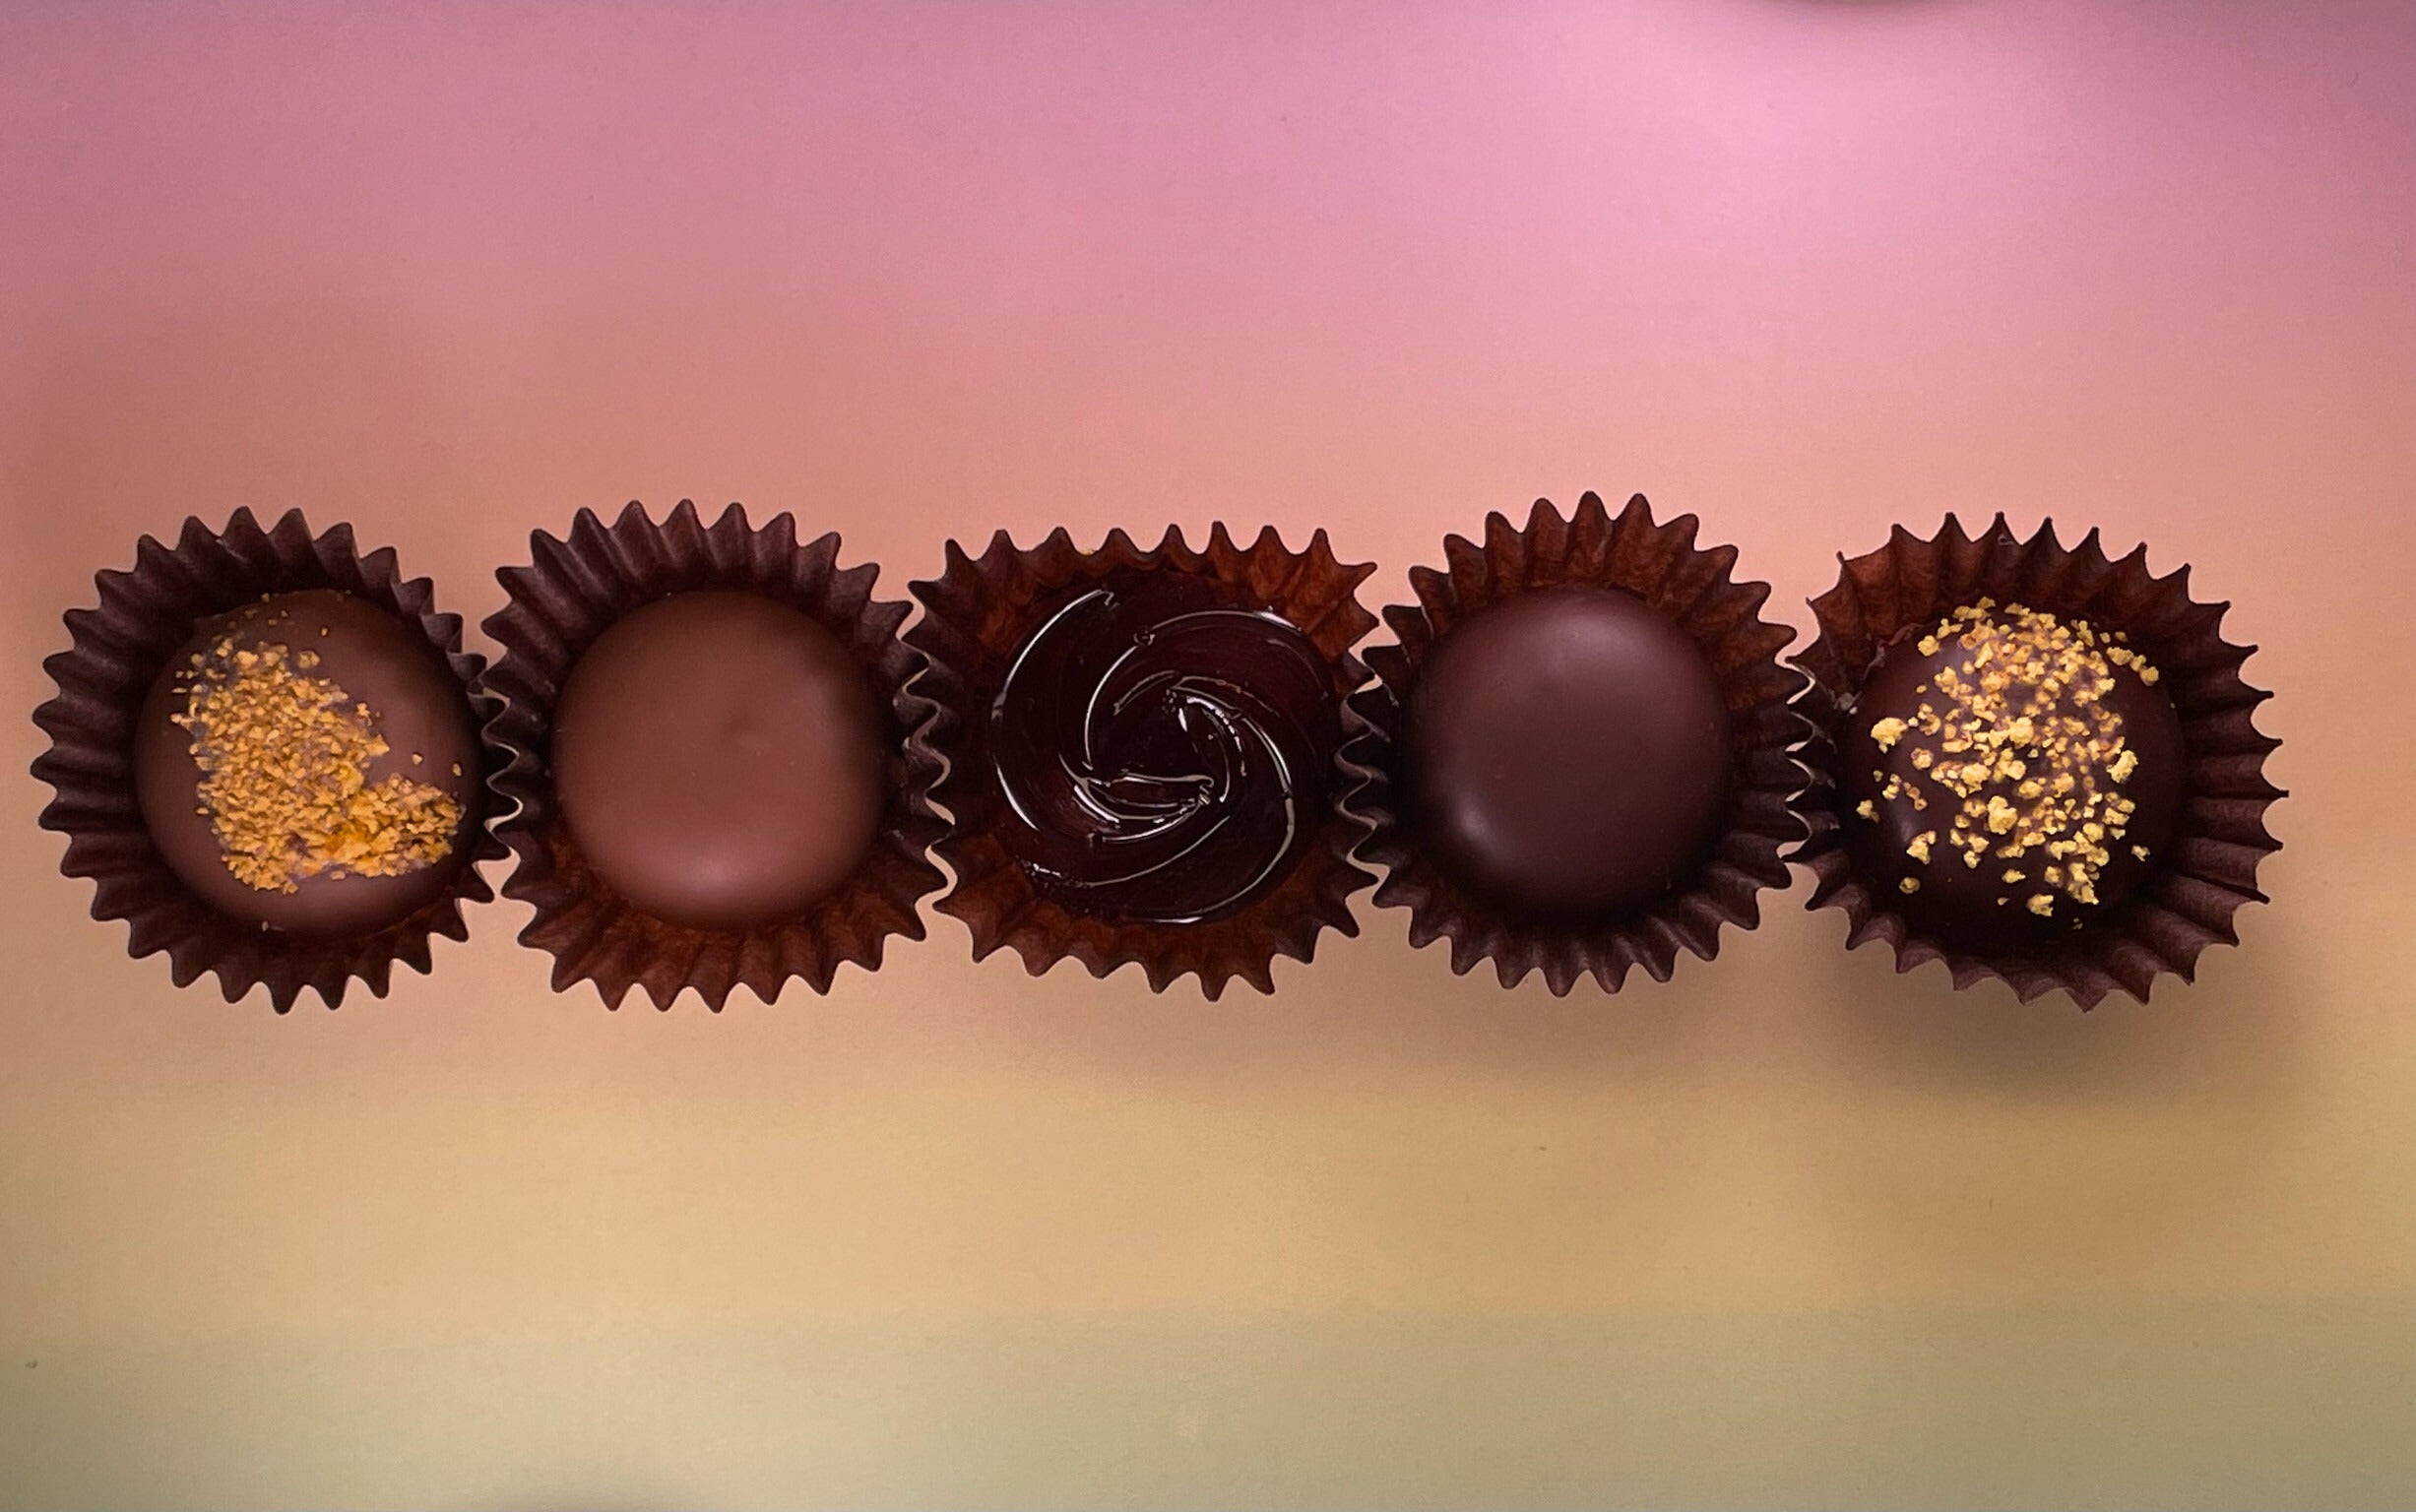
Winner picks in Europe 2026: which fruit snack is most consistent for sugar?
In 2026, people are not only shopping for taste, they are shopping for consistency. That is exactly what our award story is about, innovation that survives repeat buying, not novelty that fades.
We have won innovation prize in 2023 and 2024 in Switzerland. We also won Inovation prize 2026 in Europe. We have won Gold for K'Apples with apple and cinnamon and Silver for Raspberry and Strawberry tastes 2026 in Europe.
So when you use our Fruit Snack Sugar Content Comparison Chart mindset, you can treat awards as a signal, but we still insist on the measurable label questions. Is it no gluten no sugar added natural product? Is it clean label? Is it local apples and clean processing with no chemicals?
For a hands-on pick, browse a flavor lineup like K'Apples all flavors, one click and compare format by your day, not by internet opinions.
Use the chart in 2026: a simple checklist you can repeat every time
Here is exactly how we recommend using a Fruit Snack Sugar Content Comparison Chart in real life. You do not need a spreadsheet. You need a repeatable 4-step routine.
- Check added sugars per serving, and decide if you want the “low source” zone or the “avoid” zone.
- Verify clean label, no chemicals, local apples when possible, and a short ingredient story.
- Look for fiber integrity, because sugar plus low fiber is where the snack loses satiety.
- Match the format to the moment, bar for structure, pieces for quick bites, cloud for lighter snacking.
Need an instant browse for a sugar-focused comparison experience? Start with our product lines, for example: K-Sticks apple bars, Mélange de fruits, or K’Apples Maxi Kit mix.
And if you want the nutrition comparison in one place, use our dedicated charts like Natural snack calorie and fiber comparison chart and our ultimate glycemic load snack chart.
Conclusion: your 2026 Fruit Snack Sugar Content Comparison Chart answer
The Fruit Snack Sugar Content Comparison Chart in 2026 should not be a vibe check. It should be an added sugar check plus a fiber integrity check, then you pick the format that matches your day.
We do it the clean label way, no gluten no sugar added natural product, local apples when possible, no chemicals, and a two-ingredient core built for consistent low sugar snacking. That is exactly the philosophy behind every Kapples snack, and it is why our award winning innovations in Switzerland and Europe keep earning trust.
Frequently Asked Questions
What does a Fruit Snack Sugar Content Comparison Chart actually compare?
A Fruit Snack Sugar Content Comparison Chart compares added sugars per serving first, then supports the decision with fiber and format differences. In 2026, that combination is what separates fruit-like snacks from sugar trap snacks.
Are fruit snacks “no gluten no sugar added natural product” worth it in 2026?
Yes, because a no gluten no sugar added natural product reduces the guesswork in your daily routine. In 2026, we recommend checking added sugars and ingredients, not only the “fruit” headline.
How do I choose a healthy snack bars option for kids using a sugar comparison?
Use the chart logic, check added sugars, then check fiber integrity so the snack supports satiety. In 2026, snack for kids should be predictable, clean label, and consistent day after day.
Do I need to worry about glycemic load if I pick low sugar fruit snacks?
Yes, because glycemic impact depends on the whole snack structure, not only sweetness. That is why we pair sugar logic with GI and GL charts in 2026 for a more complete healthy snack decision.
What is the best way to compare fruit snack nutritional comparison charts side by side?
Start with added sugars, then compare fiber and protein cues, then match the format to the moment. In 2026, the “best picks” are the ones that keep sugar low without stripping the fruit structure.
Is “sugar free” the same as no added sugars in a fruit snack?
Not always. In a Fruit Snack Sugar Content Comparison Chart approach, the key is added sugars per serving, because sugar free claims can still leave sweet-taste strategies that change the overall nutrition experience.
